
Thursday the 16th of March Neo4j hosted Graphsummit in Stockholm. I fortunately attended this event in order to learn more about the company as well as its technology.
There were about 100 of us in the audience that learned from companies such as Försäkringskassan & Volvo how graphs are used to revolutionize different industries.
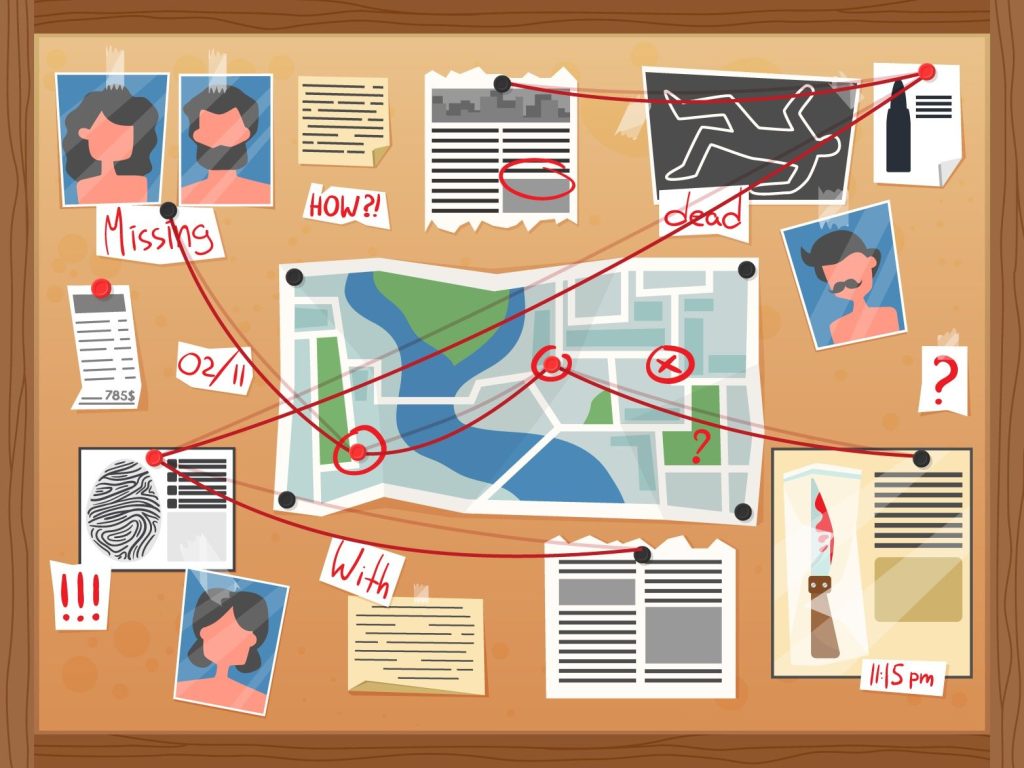
Graphs are an ancient idea of combining different points of interest into a map. The easiest graph representation for me is that classical crime scene investigation by a detective trying to map out all possible suspects;
I learned that Google’s ranking algorithm is based on graph technology. The more important a page you have, the more relationships it has and the higher it becomes in Google’s ranking.
Neo4j is based on a Swedish invention to build databases in a completely different way than it traditionally has. Instead of putting data into cells that are part of tables it’s put into nodes that have relationships to other nodes. The user interface is graphic so it’s easy to change these relationships at any given moment.
Graph Technology “kills” relationships is a title to attract your attention. However, as I learned throughout the day by practitioners at for example Scania they see graphs as a complement to traditional relational databases. There is also room for nosql databases in a large technology stack because of its benefits with unstructured data.
At the end of the day I got to practice Neo4j using a dataset of European railway stations. By applying this dataset to a sandbox in Neo4j we could eventually create a beautiful dashboard in their recently launched application called NeoDash. Now, we could easily find the quickest routes from one station to another in Europe using graph technology.
I talked to the solution architect Marco De Luca after the conference in which he told me that from dataset to a functional solution in Neo4j it took him two working days to program. The most time consuming aspect was to get the dataset into a functional pattern.
If you haven’t already started to learn about Graphs, it’s due time for you to start!